Site selection for rain water harvesting through GIS and Remote Sensing Technology
Project Background:
In semi-arid and arid regions, sustainability of agricultural system is most challenging in view of economical approaches for agricultural water management and its ensured accessibility. Rainwater flows of hill torrents have potential prospects for development to meet growing strain of water for agriculture. However to harvest this rainwater potential through traditional systems is not a success story. This project discusses GIS and Remote Sensing tools application as a strategy to explore viable and economical prospective of rainwater management for agricultural purposes. The fundamental problem is the optimal conservation of hill torrents flows and management of these water resources. To tackle this problem, a project for reservoir site selection was carried out. In this project, we present cost effective approach to mitigate the flood hazard while conserving this rainwater as irrigated water supply to minimize drought threats for a spate irrigation system. The uniqueness of project is development of a methodology for estimation of water holding capacity for reservoir by using geo-informatics tools. As a supplementary output, a geo database is generated for intend to use its attribute data and spatial data for future research projects. This geo database include data layers of satellite imagery, High resolution Digital Elevation Model, GPS aided ground control points, irrigation network, catchments/sub-watersheds, administrative boundaries, proposed reservoir site location and digitized linear and polygon features. The outcomes of this project illustrate that agricultural water management would be carried out efficiently with the use of developed methodology. The reliability of proposed reservoir solution is higher due to the use of high resolution datasets.
There is a great potential for regulation/conservation of rain water/flood flows in various regions of the country. Large tracts of fertile agricultural land are also available which can be used for the development. Rod-Kohi is a runoff farming system being practiced in piedmont plains. Runoff from hill-torrents is directed through a network of conveyance system to provide deep watering of 1-1.5 m depth to bunded fields. The water availability depends on the occurrence and distribution of rainfall and the hydrology of the runoff based on the watershed characteristics. The reliability, adequacy and predicting of the hill torrents are the major issues of these areas. The farming is practiced under conditions of floods and droughts - too much or too little water. During floods the excess water not only damages the crops but also affects the infrastructure. The uncertain hill-torrents water cause floods or prolonged droughts. The distribution of water is variable along the command area. At the head the problem is too much water, whereas tail reaches receive water only if the quantity is in excess of the upper reaches. Some of the tail reaches receive water once in three years. The most critical element of the Rod-Kohi system is the earthen diversion dam built across the flow to divert water. If the bund resists the flow and stay until the command area is watered the farming is practiced otherwise, if the bund is washed prior to the water diversion and spreading than there might not be any irrigation during the whole season.
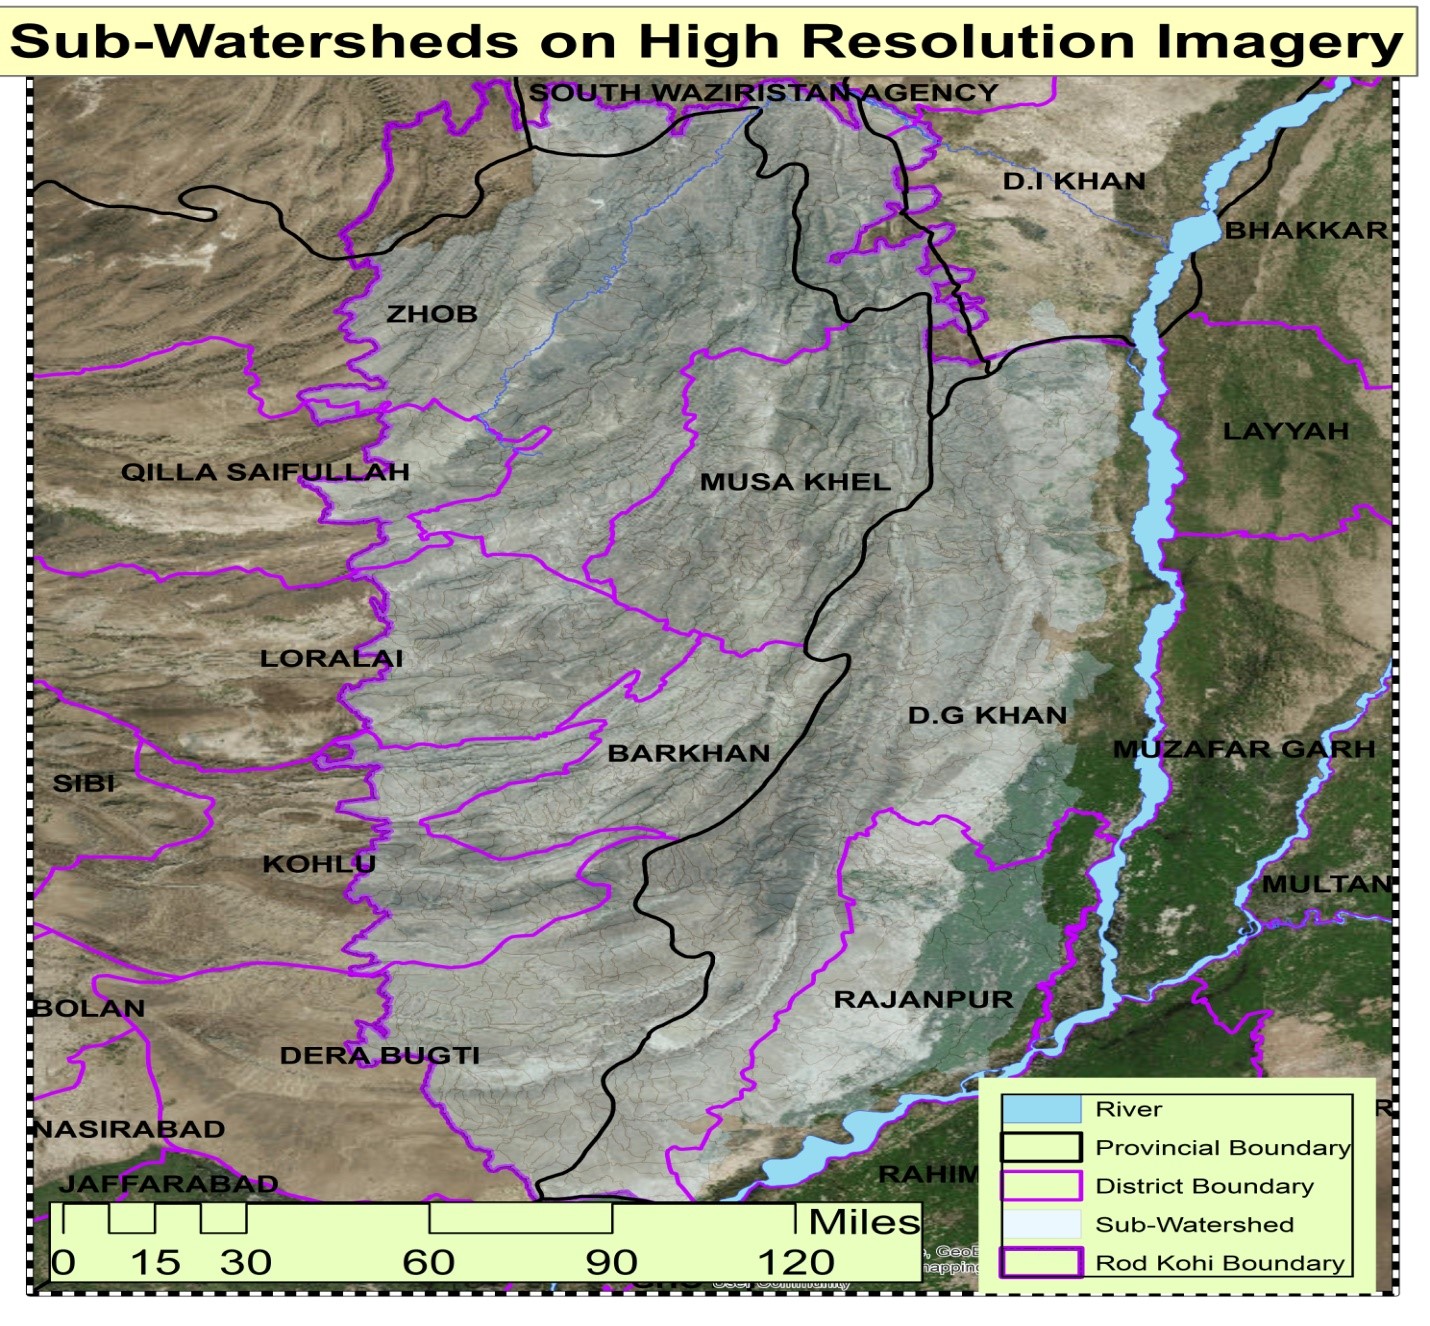
Location Map
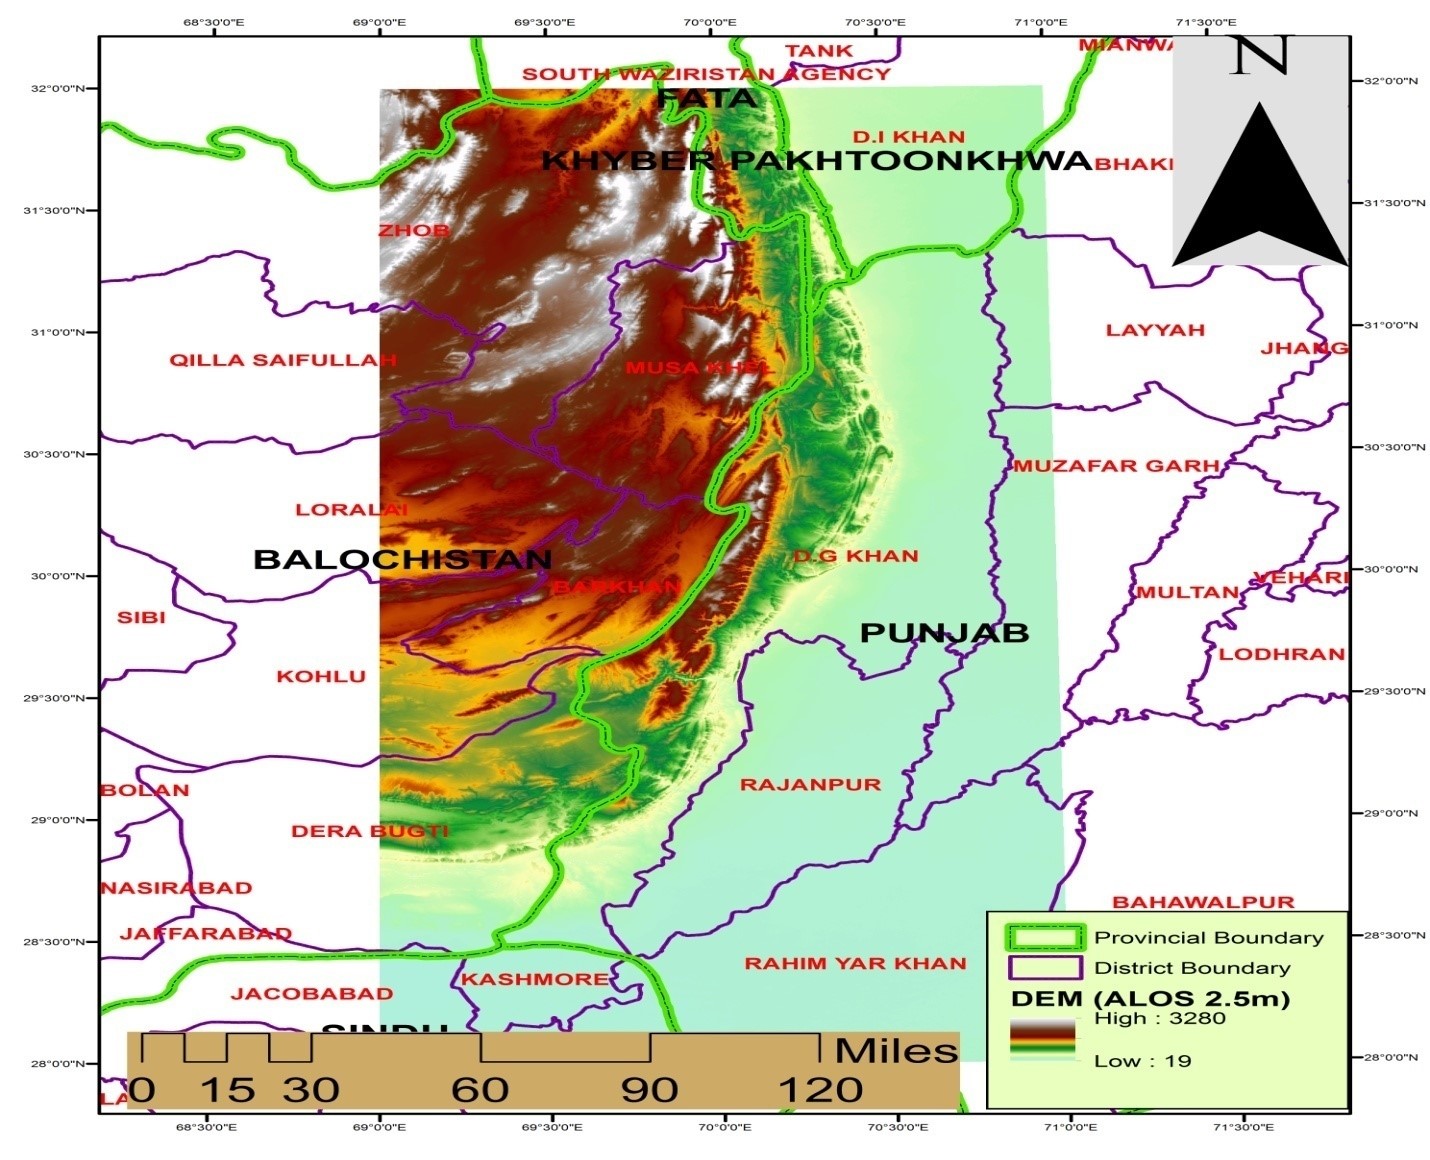
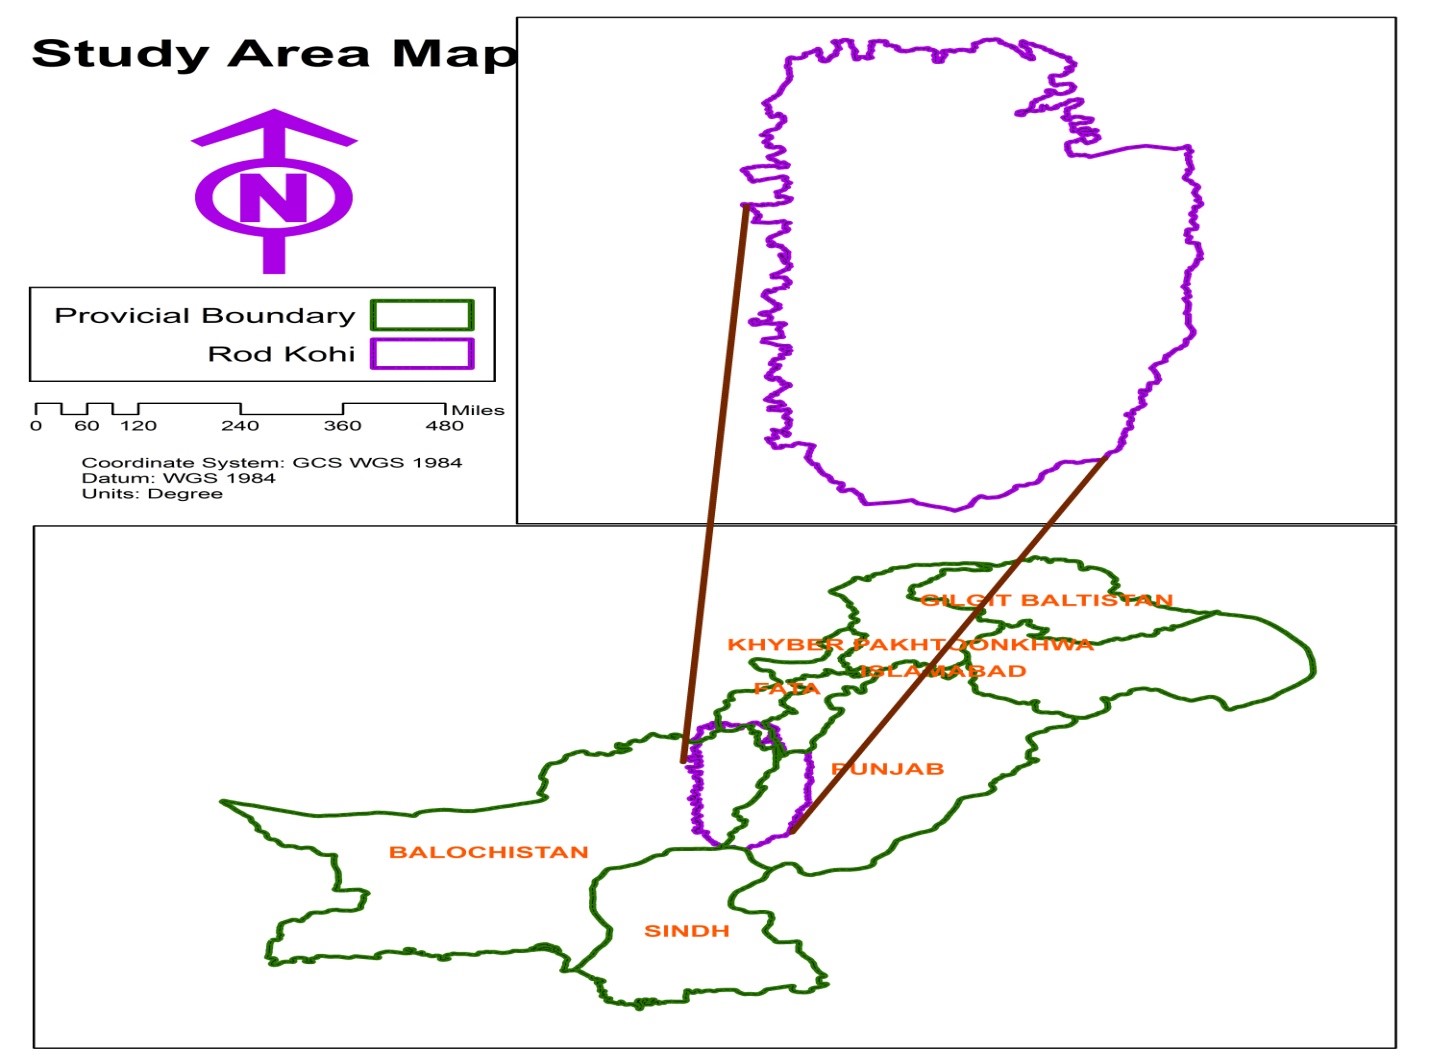 • Figure 1 :Location Map of Project Area
Climate of Rod Kohi:
The climate of the Rod-Kohi areas in NWFP, Punjab and Sindh provinces is arid to semi-arid with precipitation ranging from less than 100 mm in South West (Dadu, Sindh) to 300 mm in North West (D.I. Khan, NWFP) as shown in figure 2. In Kharif season, rain is received in the months of July and August and in ‘Rabi’ season in the months of March and April. June is the hottest month with a mean maximum temperature of 44˚C while January is the coldest month with a minimum temperature of 4˚C as shown in figure 3. In Balochistan, however, the climatic conditions differ from the rest of hill torrent areas in the country. Its climate is arid to semi-arid in winter and arid to hyper-arid in summer. Rainfall is erratic and is received in monsoon as well as in winter. Due to wide variability of temperature regime, the climate of the province varies from cool temperate to tropical allowing an amazing variety of crops to grow economically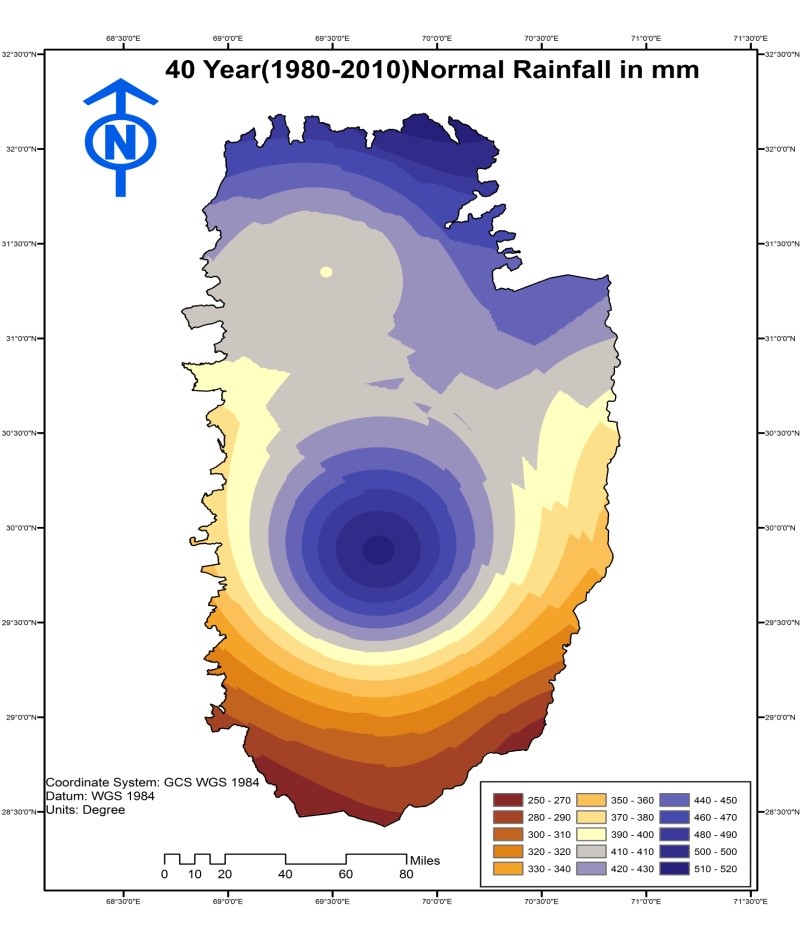 • Figure 3 :Normal Rainfall 1980-2010 mm
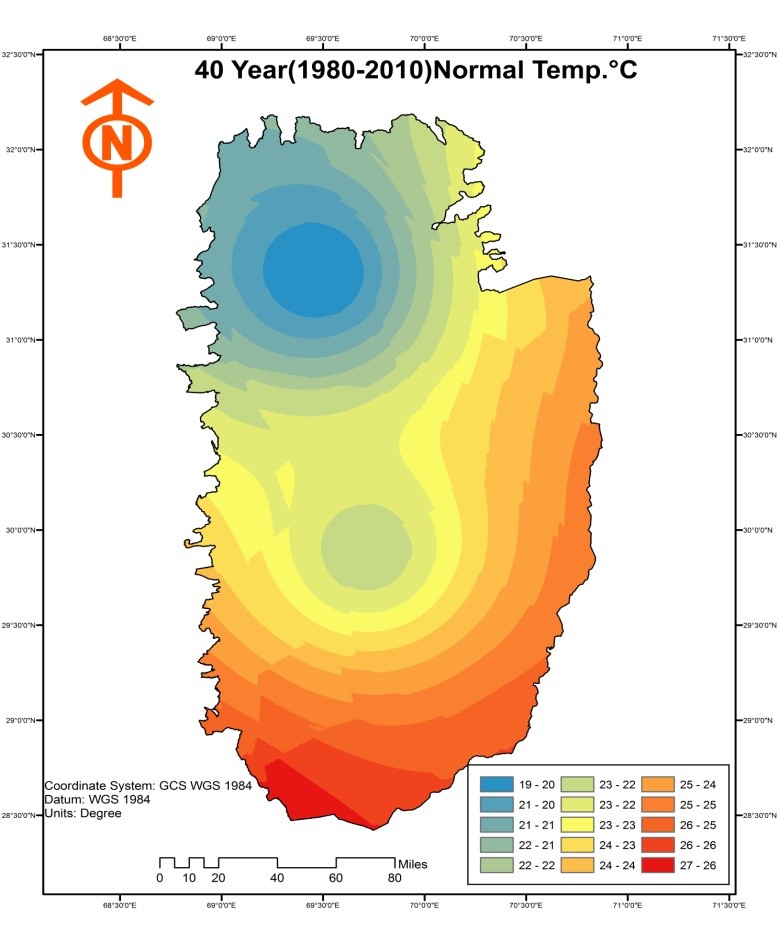 • Figure 4 :Normal Temperature 1980-2010 °C
Soil texture and Land Cover:
Soil texture and structure, bulk and particle densities, and porosity are the major soil physical properties that determine the extent of the water-storage capacity of the soil as mapped in figure 4. The principal crops grown are wheat, sorghum, millets, gram and pulses. Wheat is sown in major part of the Rod-kohi region. The land use is mainly continuation torrent water cropping and live stock grazing. Some irrigated faming also exists in areas where perennial water of springs is available for irrigation. Mainly fruit orchards like of apple, peach, plum, apricot and grapes, and crops like wheat, maize and alphalfa are grown here. Water is harvested for irrigation, which is known as ‘Khushaba’. On higher altitudes, there are forests of juniper and wild olive, which merge with barren lands with scanty bushes and grasses in low-lying areas. Vegetation is xerophytic and is characterized by thorny scrubs and poor grasses in the lower regions. In the south sorghum and millets are the important crops. Along the coast, castor bean is grown wherever water is available from springs or ‘karezes’. The main sources of revenue are livestock nurture and agriculture production based on perennial flows and hill-torrent flood irrigation. The natural vegetation provides an ample source for livestock grazing.
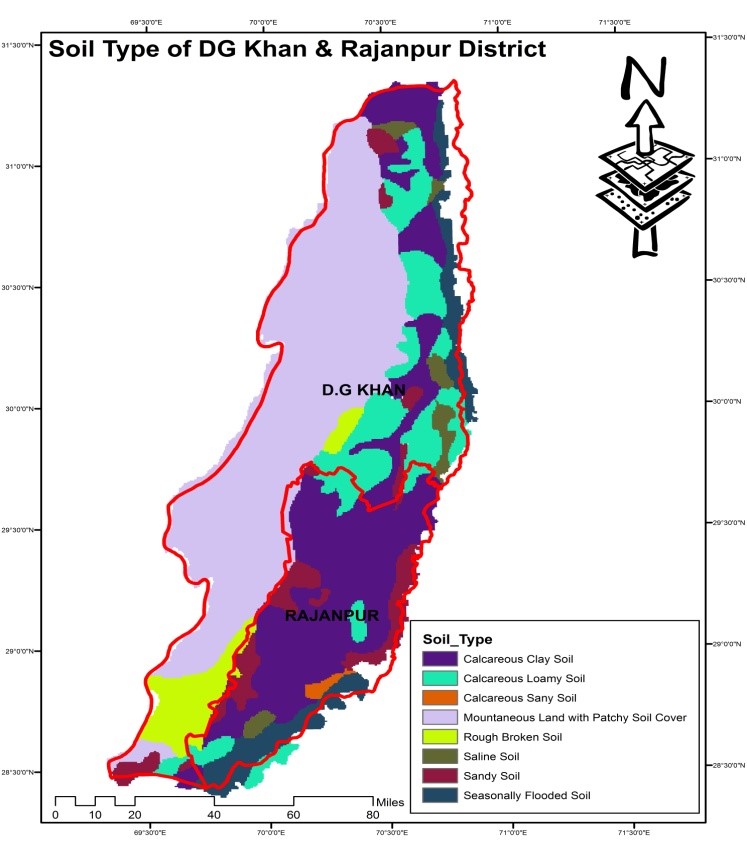 • Figure 3 :Soil Type of DG Khan & Rajanpur
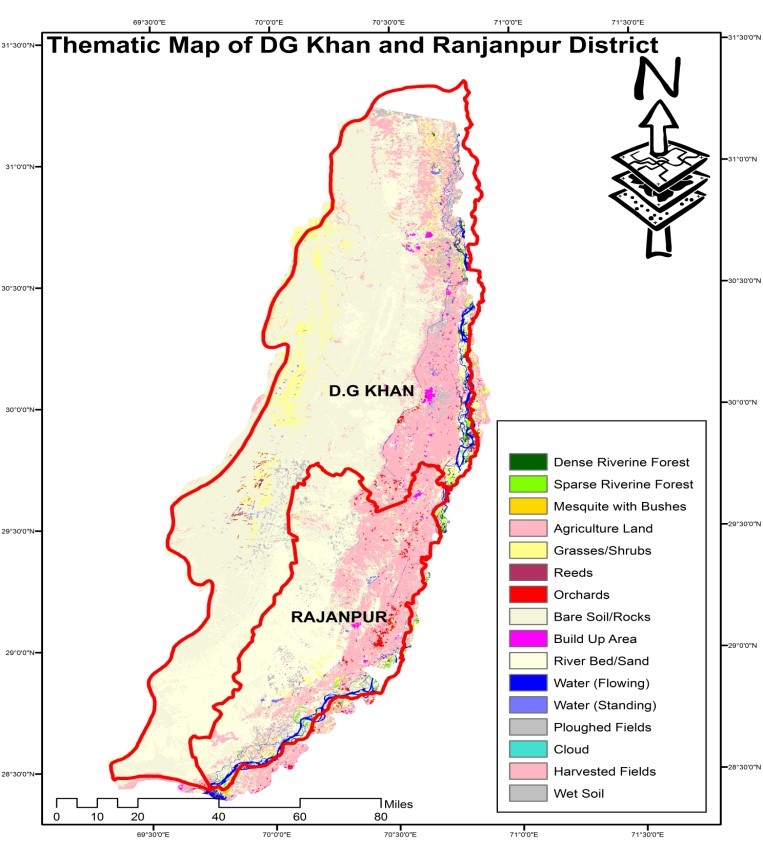 • Figure 4 :Thematic Layer of DG Khan & Rajanpur
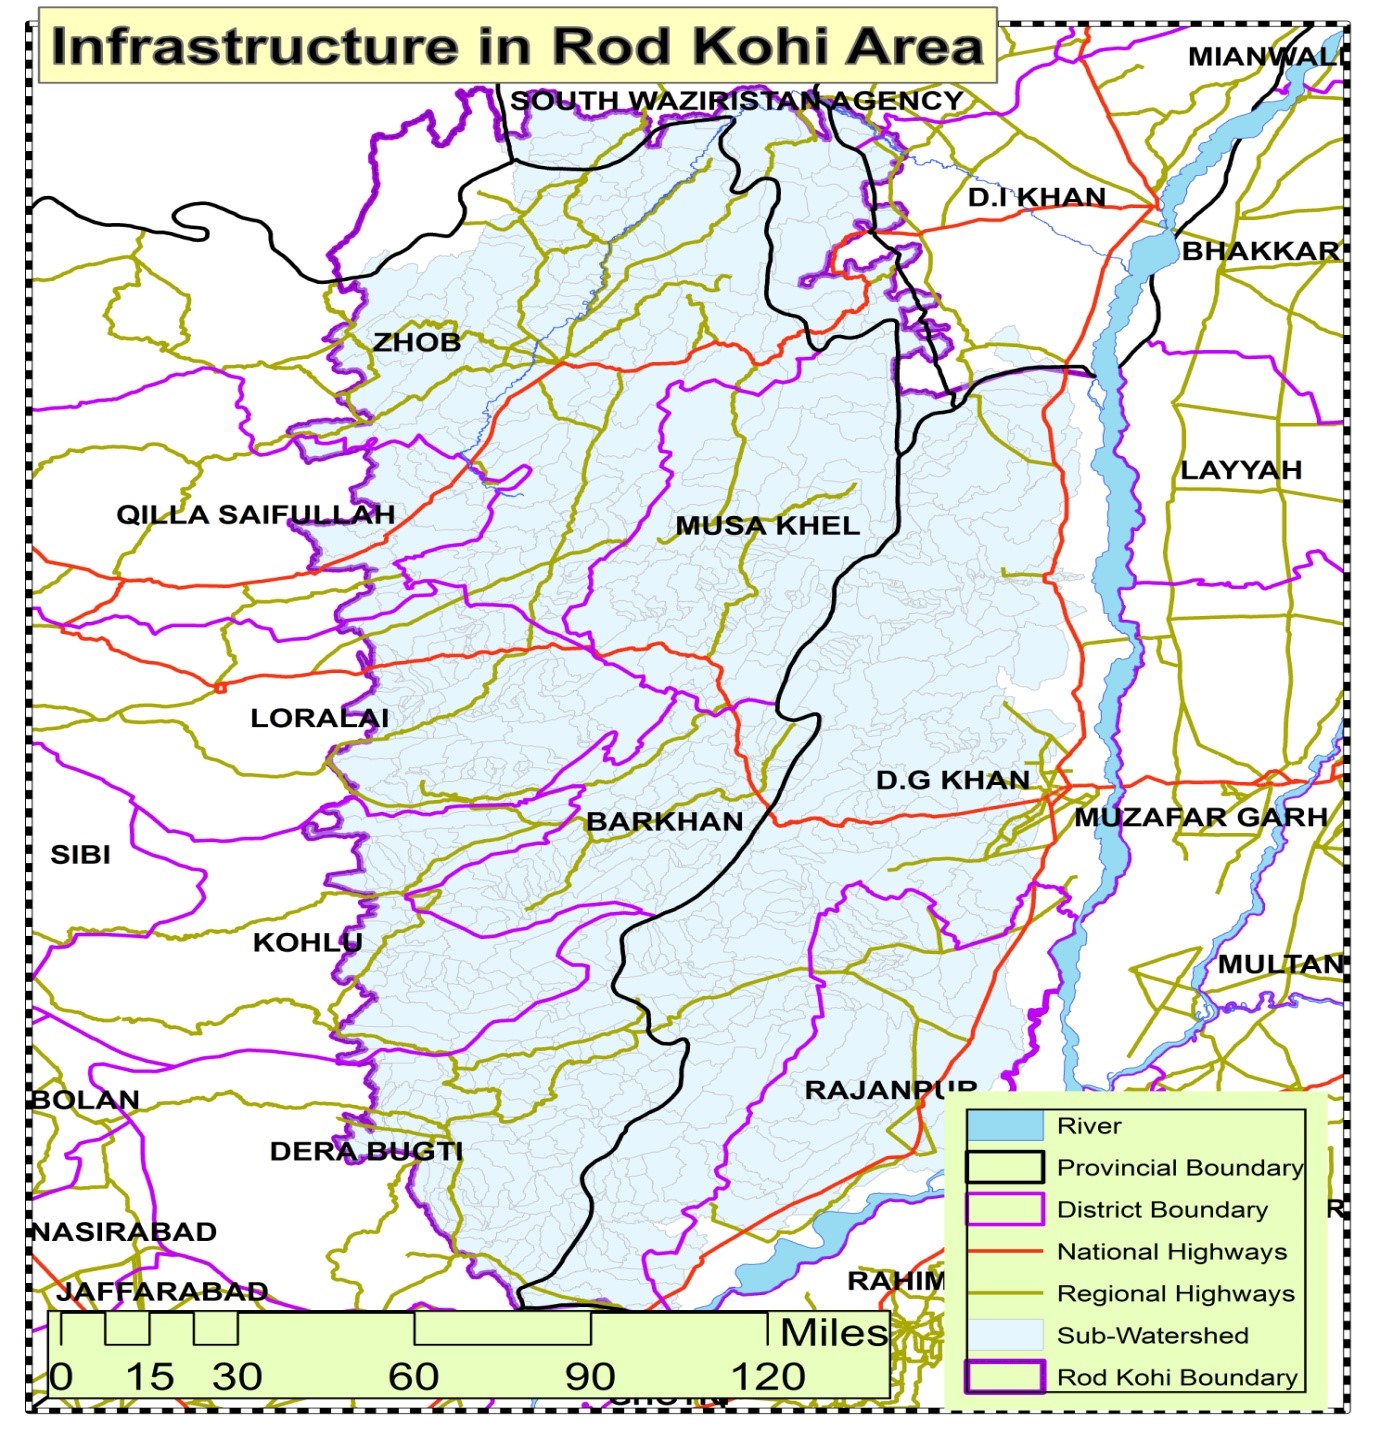
Material and Methodology:
DEMs are used in water resources projects to identify drainage features such as ridges, valley bottoms, channel networks, surface drainage patterns, and to quantify sub catchment and channel properties such as size, length, and slope. The accuracy of this topographic information is a function both of the quality and resolution of the DEM, and of the DEM processing algorithms used to extract this information. Watershed delineation is one of the most commonly performed activities in hydrologic analyses. Digital elevation models (DEMs) provide good terrain representation from which watersheds can be derived automatically using GIS technology. The techniques for automated watershed delineation have been implemented in various GIS systems and custom applications (Garbrecht and Martz, 1999). In this project, we performed drainage analysis on a digital elevation model for Rod Kohi area. The Hydrology tools are used to derive several data sets that collectivity describe the drainage patterns of the catchments. Raster analysis is performed to generate data on flow direction, flow accumulation, stream definition, stream segmentation, and watershed delineation. These data are then used to develop a vector representation of catchments and drainage lines from selected points. The utility of Hydrology tools in GIS are used to develop attributes that can be useful in hydrologic modeling. The main data is the DEM (ALOS 2.5m) to get as much accurate results as could.
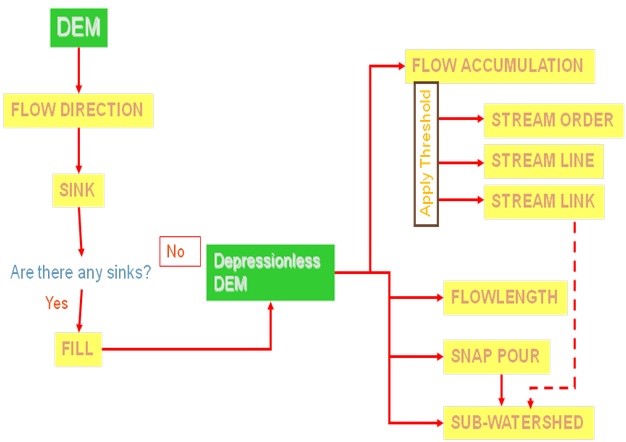 • Figure 6 :Flow Chart for Delineation of Sub-watershed
Digital Elevation Model (ALOS 2.5):
The Advanced Land Observing Satellite (ALOS) has been developed to contribute to the fields of mapping, precise land coverage observation, disaster monitoring, and resource surveying. The Panchromatic Remote-sensing Instrument for Stereo Mapping (PRISM), carried on ALOS satellite is expected to generate worldwide Digital Maps in respects of its high resolution and stereoscopic observation. The development and evaluation of the software (ER DAS Imagine) for generating Digital Elevation Model (DEM), based on this aim of ALOS operation, is now task for the purpose of equipping the system which producing DEM semi-routinely in the Earth Observation Research and application Center (EORC). In this paper, the software's outline of functions, the algorithm and the current status of its development and evaluation are described. PRISM consists of three panchromatic radiometers for forward, nadir, and backward views and acquires each image in the same orbit at almost the same time. It enables to generate more accuracy DEM frequently than usual stereoscopic observations. For this specific stereo image configuration, the triplet images matching algorithm is applied for the DEM generation in LPS ER DAS Imagine.
 • Figure 7 :Flow Chart for Delineation of Sub-watershed
Dynamics of Drainage System in GIS:
The area upon which waterfalls and the network through which it travels to an outlet Flow of water through a drainage system is only a subset of what is commonly referred to as the hydrologic cycle .Includes precipitation, evapotranspiration, and groundwater flow. Hydrology tools in ArcGIS focus on the movement of Surface water. A drainage basin is an area that drains water. Drainage basins are watershed, basin, catchment, or contributing area. This area is normally defined as the total area flowing to a given outlet, or pour point. A pour point is the point at which water flows out of an area. This is usually the lowest point along the boundary of the drainage basin. The boundary between two basins is referred to as a drainage divide or watershed boundary. In this we are used Hydrological modeling in ArcGIS for dynamic drainage system in GIS as shown in figure 8.
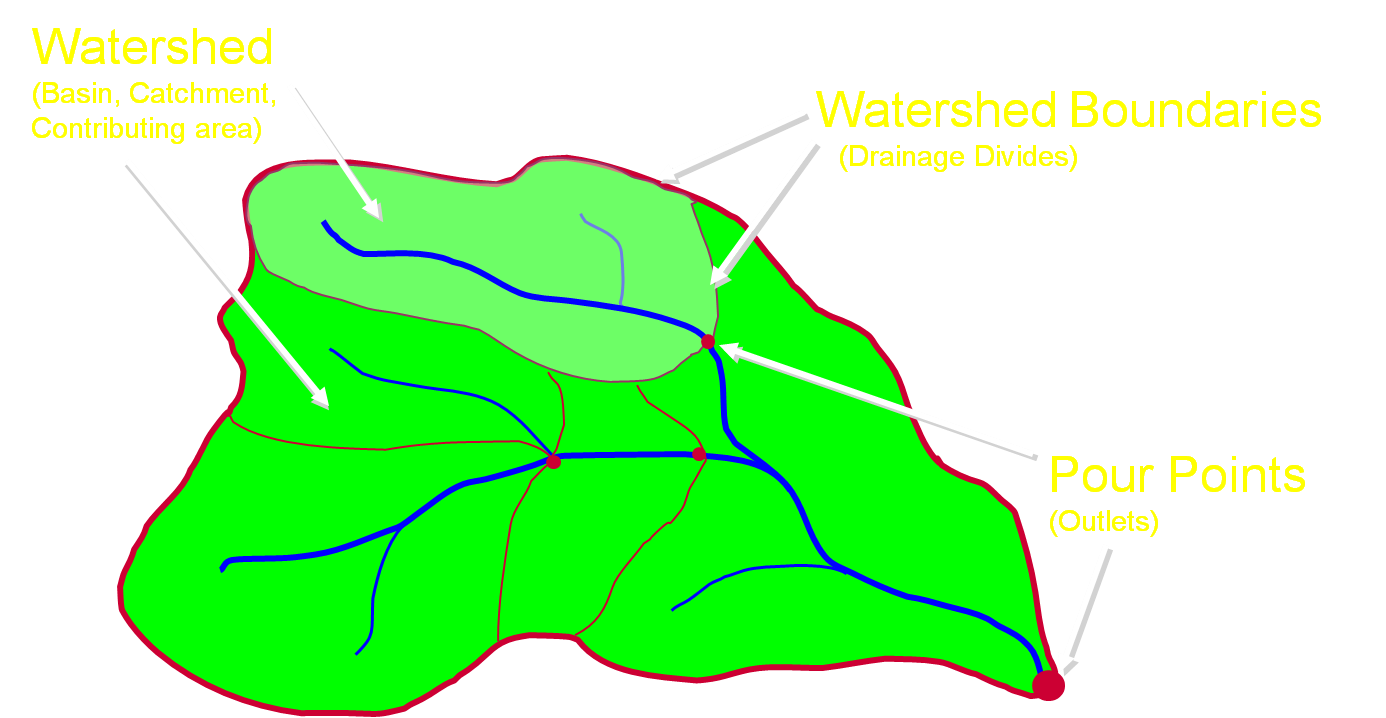 • Figure 8 :Dynamics of Drainage System
Identifying Sinks and Fill Sink:
Sinks can be located using the Sink tool. This tool requires a direction raster that is created by the Flow Direction tool. The result is a raster that identifies any existing sinks in the data. Depending on the results, you can fill the sinks, or you can use the output to help determine the fill limit. Sinks can be filled using the Fill tool, after DEM generated in LPS ER DAS Imagine.
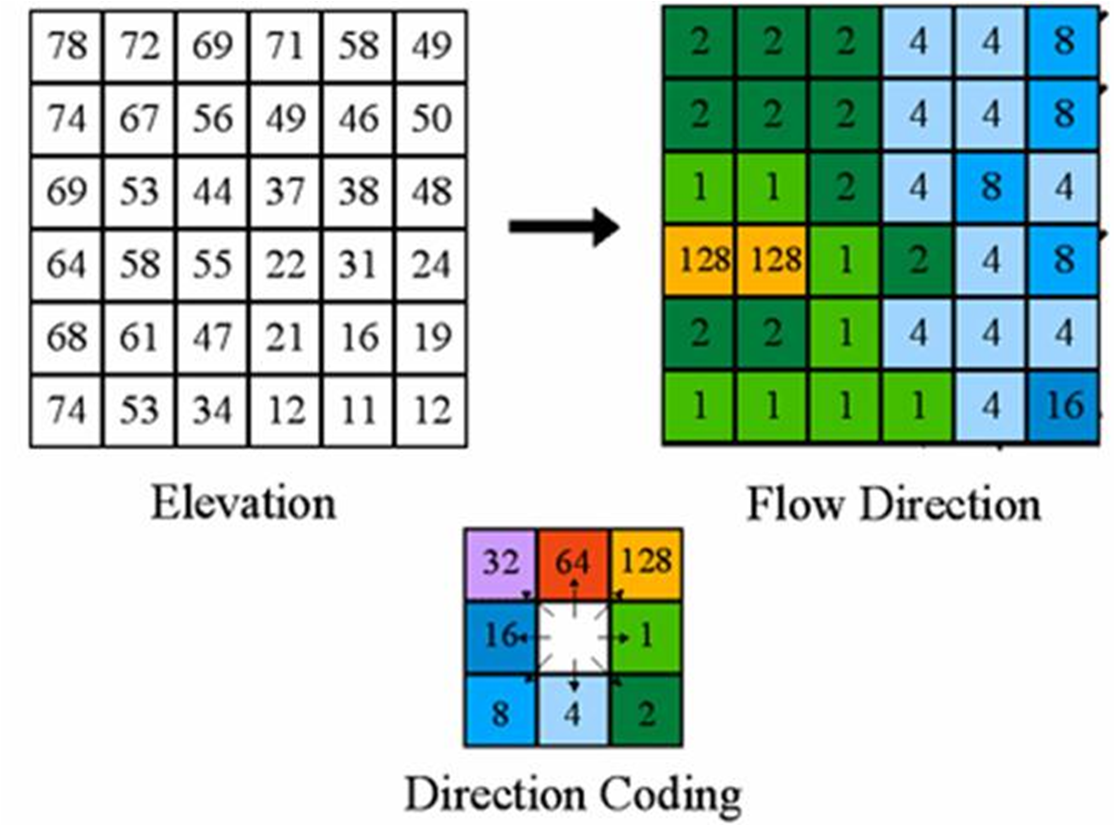
Flow Direction and Flow Accumulation:
Flow Accumulation is a raster of accumulated flow to each cell, as determined by accumulating the weight for all cells that flow into each down-slope cell. Cells of undefined flow direction will only receive flow; they will not contribute to any downstream flow. A cell is considered to have an undefined flow direction if its value in the flow direction raster is anything other than 1, 2, 4, 8, 16, 32, 64, or 128.
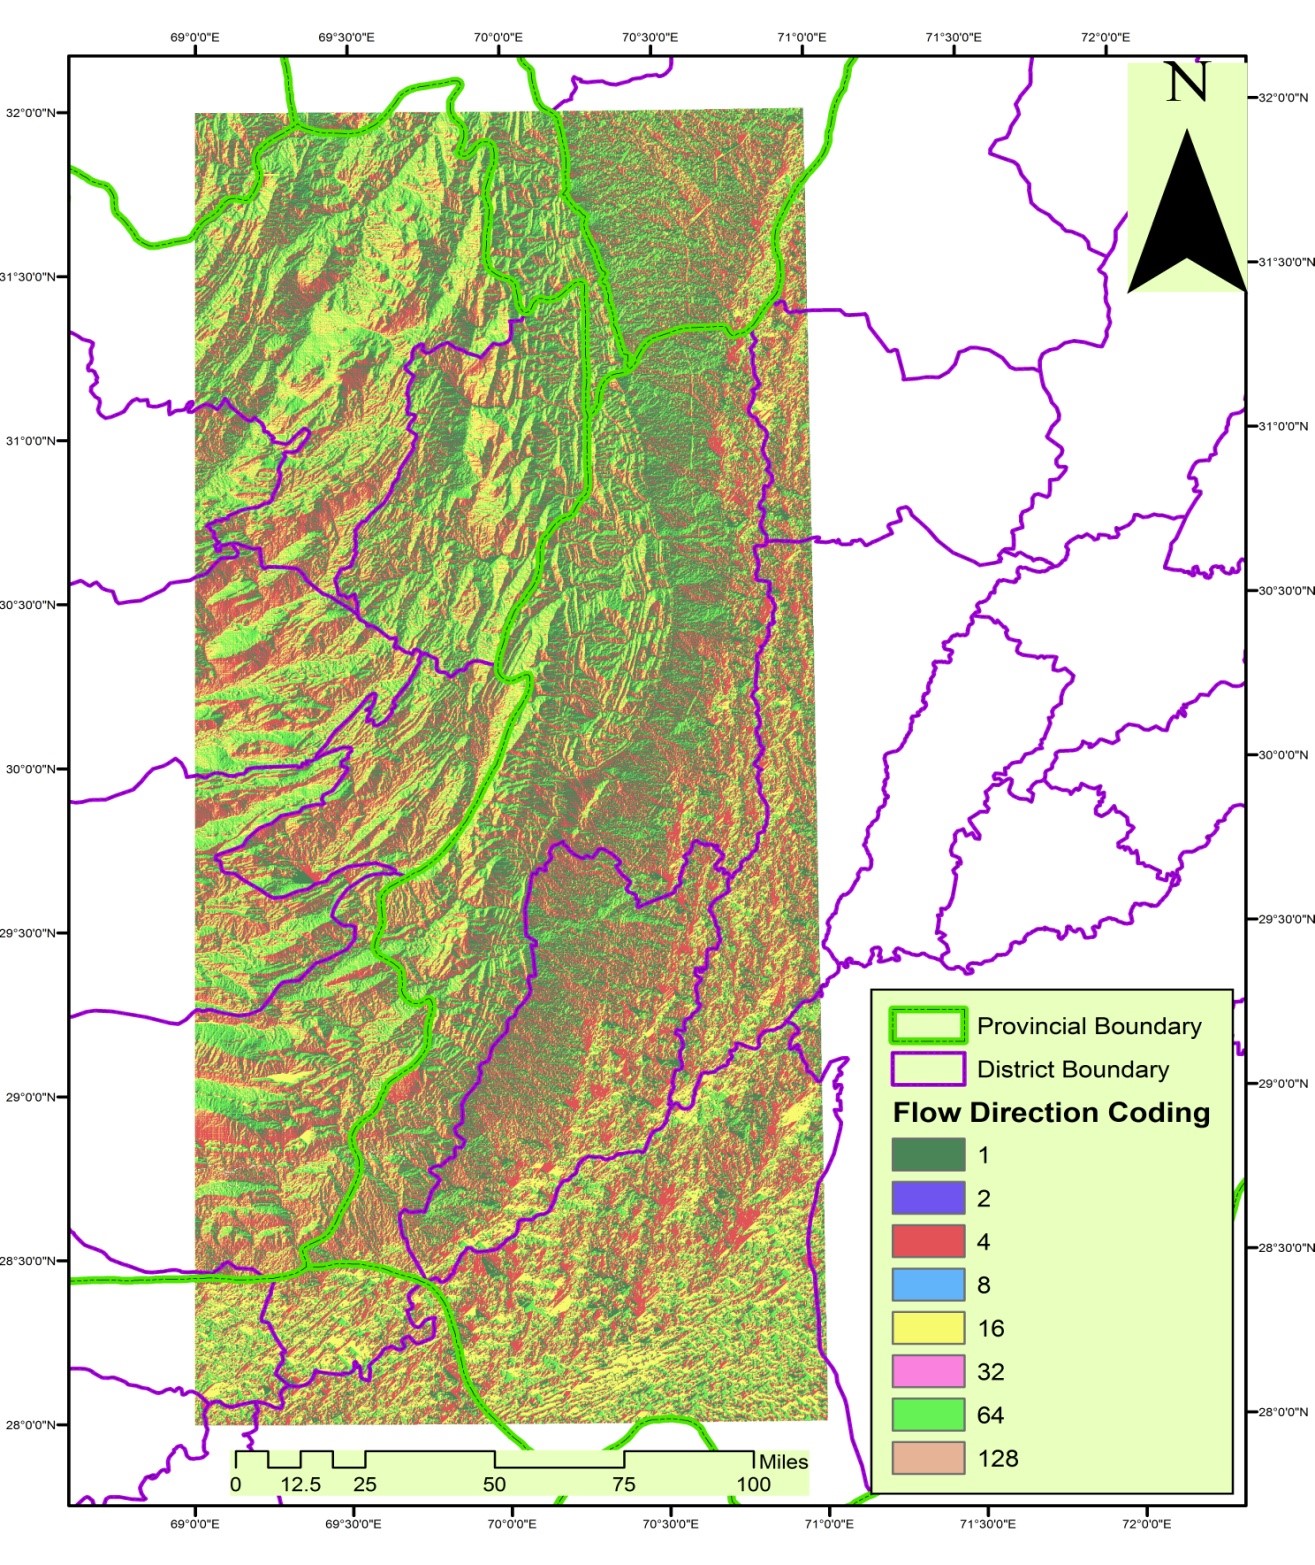 • Figure 9 :Flow Direction
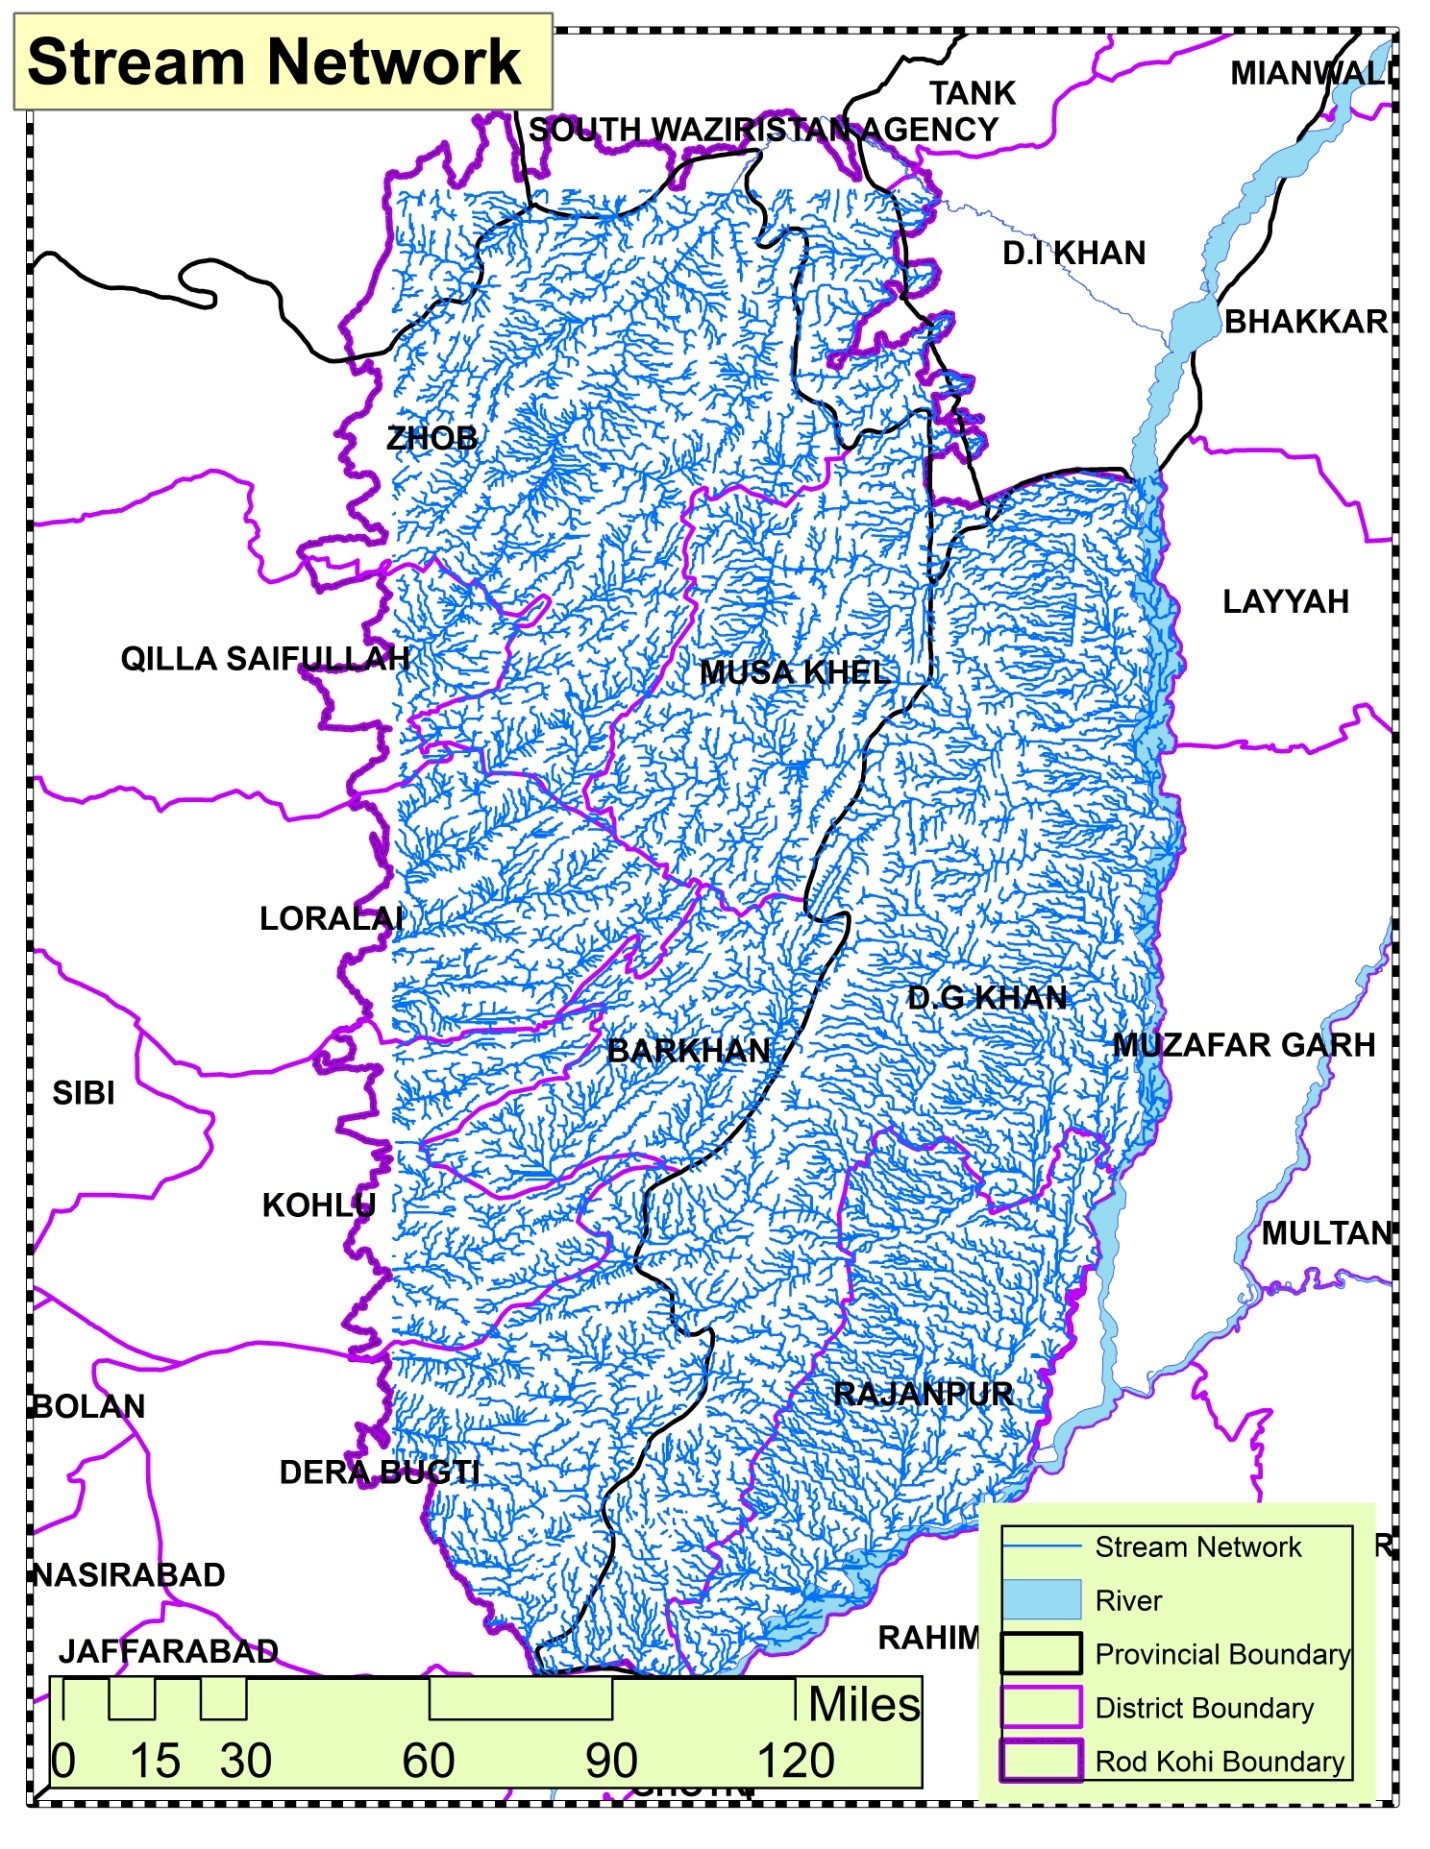
Stream Networks:
Stream networks can be delineated from a digital elevation model (DEM) using the output from the Flow Accumulation tool.
Flow accumulation in its simplest form is the number of upslope cells that flow into each cell.
By applying a threshold value to the results of the Flow Accumulation tool using either the Con or Set Null tools,
a stream network can be delineated by using below algorithm coding.
Expression : "Value > 20000"
Input true raster or constant value : 1
Input false raster or constant value : ""
Output raster : stream_net
OR
With the Set Null tool:Input conditional raster : flowacc
Expression : "Value <= 500"
Input false raster or constant value : "1"
Output raster : stream_net
Sub-Watershed Delineation:
For precise demarcation of sub watershed delineated watersheds automatically from ALOS Digital
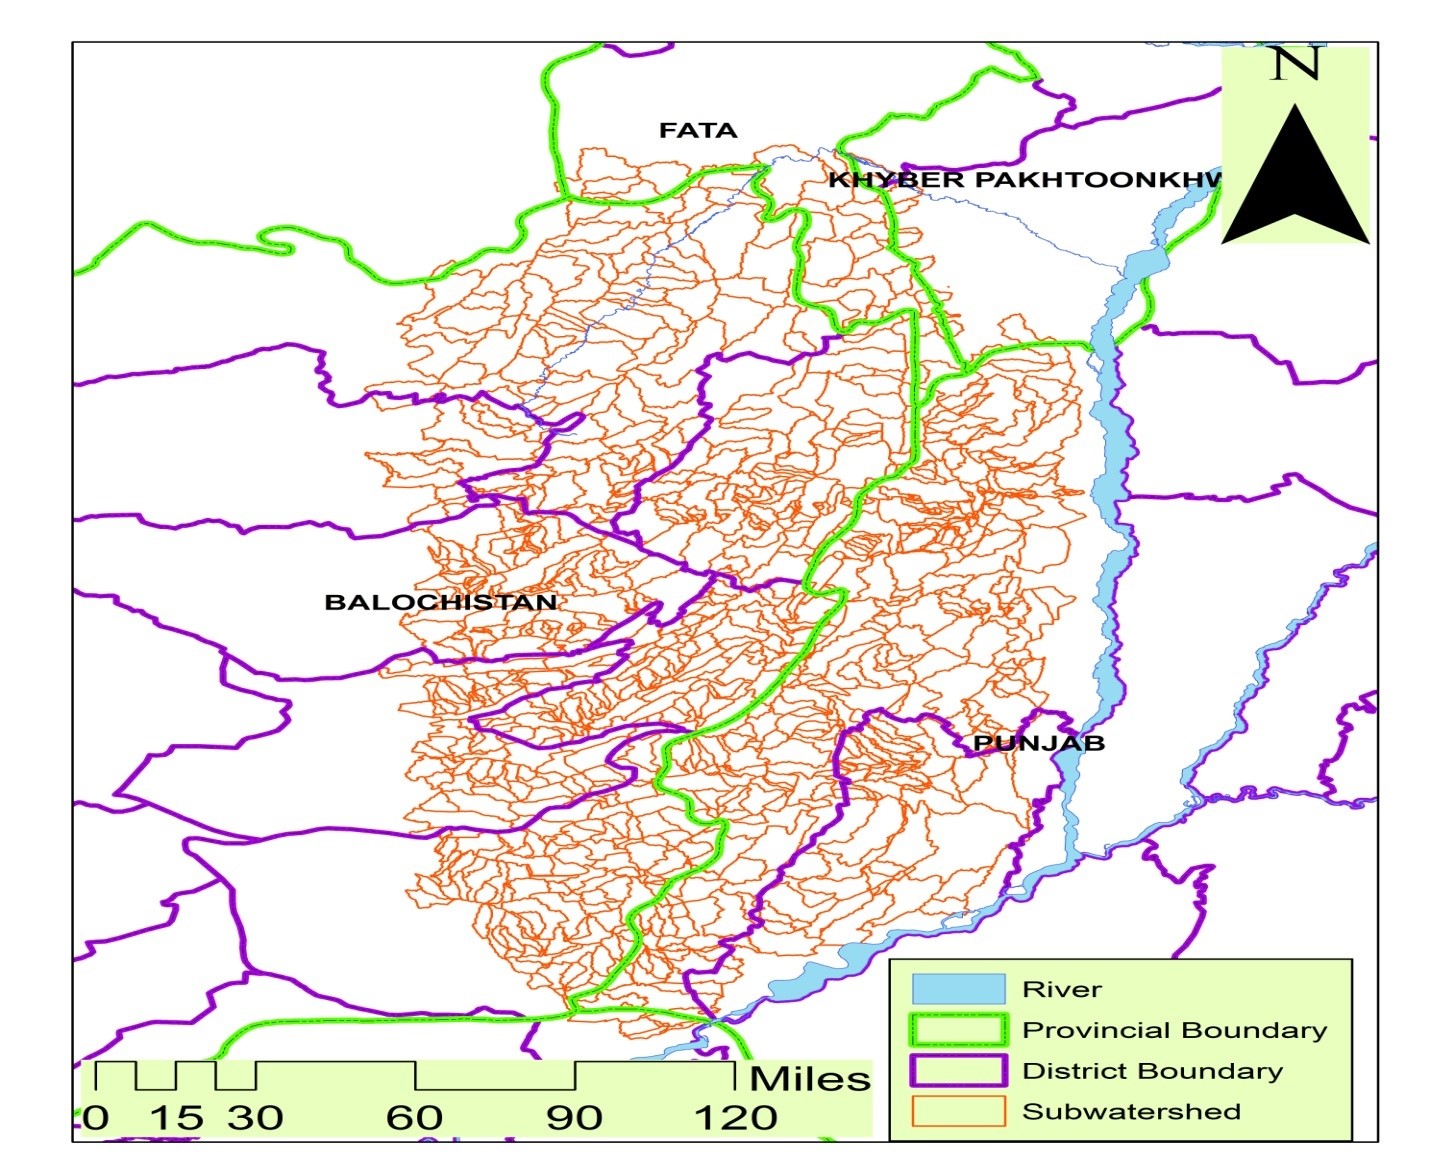
 • Figure 10 :Sub Watershed Delineated
Impacts of dam on agriculture:
The management of flood flows for agricultural development essentially requires a comparative study of pre and post project level of production. The runoff of Rod Kohi catchment if trapped with the proposed reservoir/sub watershed then existing cropped area would be increased moreover it can also assume that yield per acre will also increase. It is a fact that man needs to conserve the water resources and to manage water system for efficient use. This need is growing more due to population increase. Resultantly, a sustainable and manageable spate agricultural system would be a solution to minimize the gaps between demand and supply of agricultural products. This study outlines a procedural approach using GIS and remote sensing techniques to identify potential site for harnessing floodwater for command area. The used datasets includes Digital Elevation Model, satellite imagery, topographic sheets, ground survey and developed geo-database. The stream network would be suitable to locate potential sites for field structures as an improved strategy for development and up gradation of irrigation water network.