GIS based household Survey planning
INTRODUCTION:
GIS aided by satellite remote sensing were used in the entire planning. GIS provides the tools necessary to research, develop, implement, and monitor the progress of a project and manage site location, economic analysis and other critical facets. The planning aspect of a survey project has a number of unique requirements depending on its area, purpose, and overall goal. GIS technology helps full these demands by facilitating traditional tasks more efficiently and easily accomplishing new tasks that were previously impractical or impossible.
Preliminary Planning
Equipped with GIS tools, surveyors quickly determine sensitive areas; canopy; local control; road networks; previous established boundaries; and zoning, permit status, and other critical information. These enhanced capabilities eliminate redundant efforts and promote coordination with other planning and government agencies. The information is stored and easily accessed for reuse with any project related to the location.
Brief Methodology:
The proposed methodology made use of following data:pulation Census data: Details included were urban rural population of all tehsils along with union council names.
Landscan data: LandScan is developed using best available demographic (Census) and geographic data, remote sensing imagery analysis techniques
within a multivariate dasymetric modeling framework to disaggregate census counts within an administrative boundary.
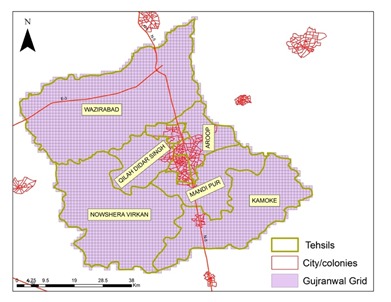
GIS layers: District, tehsils, City, colonies (for urban areas) and Union council boundaries
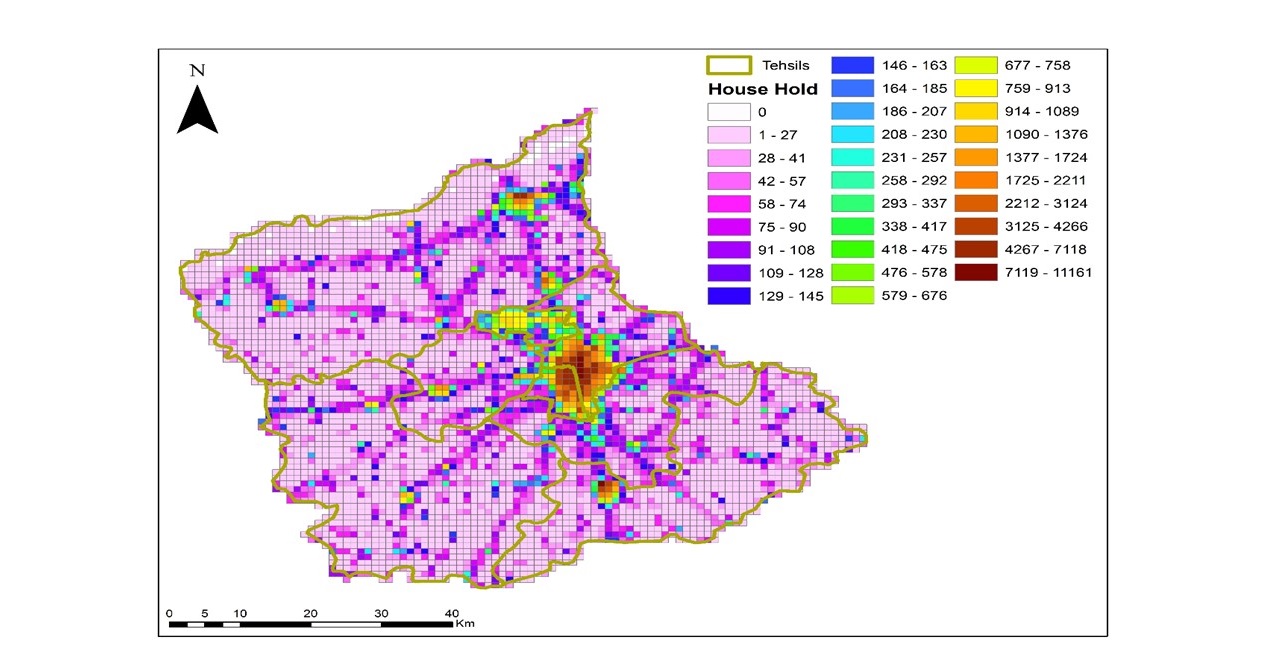
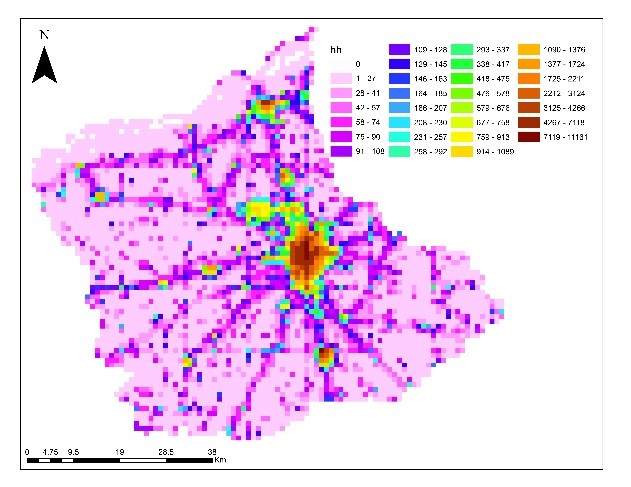
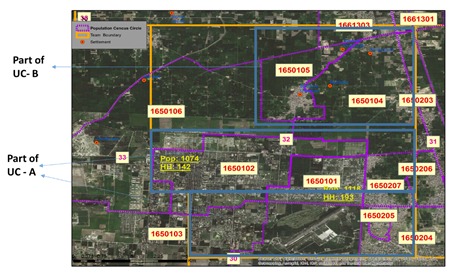
Following operations were executed to allocate teams for carpet surveying in the districts: Firstly, population census data along with landscan image (which show population) were overlayed and determined where households are located spatially (Figure 1 & 2).
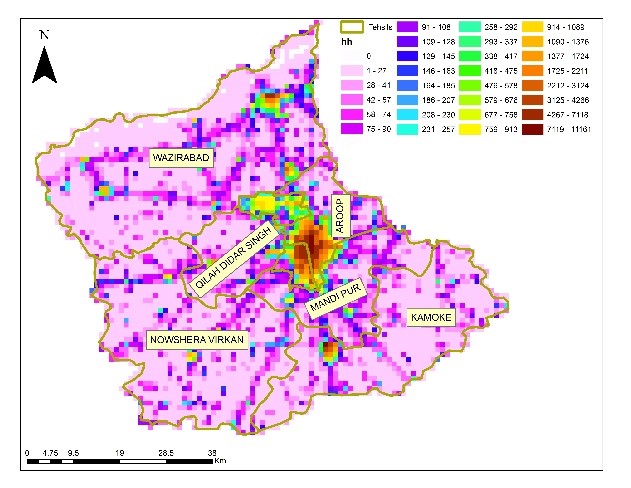
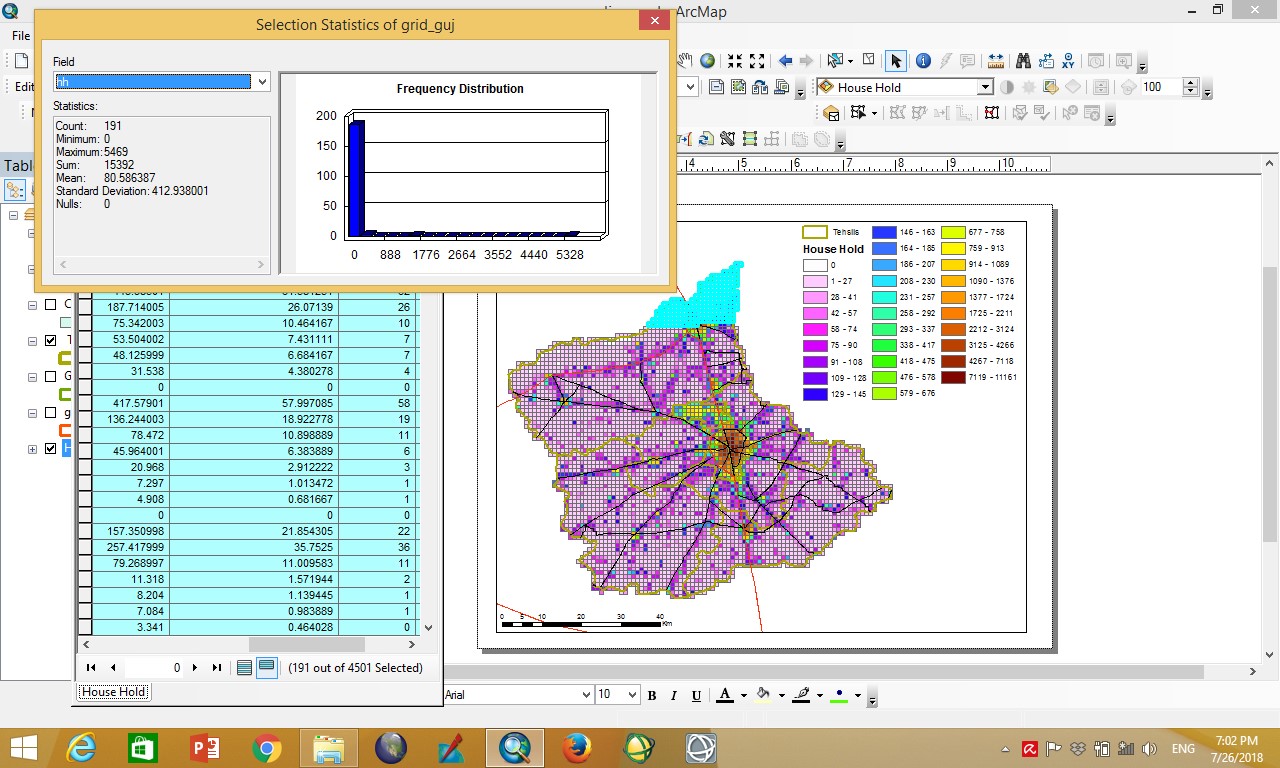
Secondly, the whole district were divided into grids of 1 square kilometer and data of households were extracted through GIS spatial analysis (Figures 2 & 3).
 • Figure 2: 1 Sq. Km grid cells
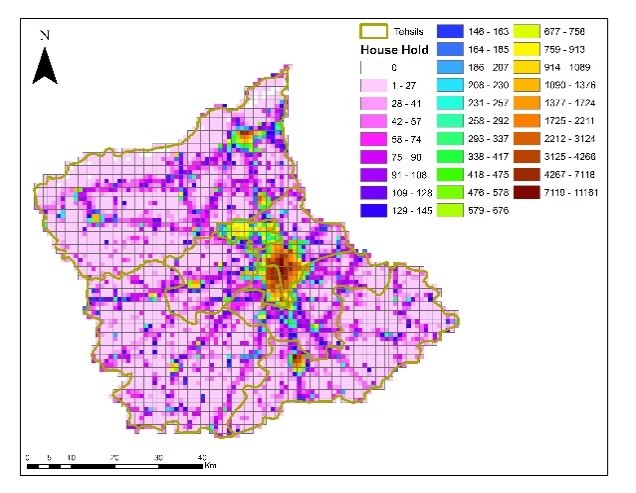 • Figure 3: Population at grid level
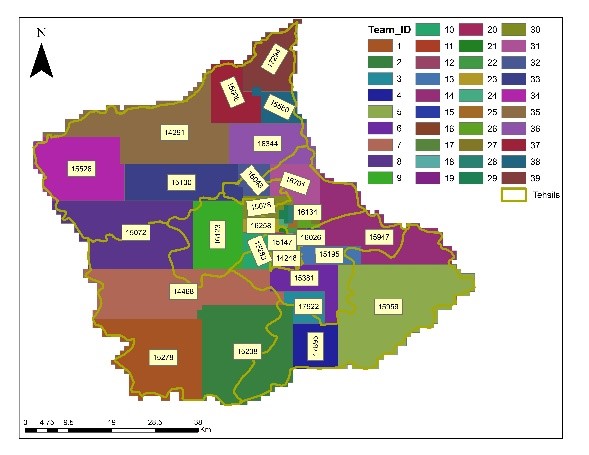 • Figure 4: Teams with no. of Houses
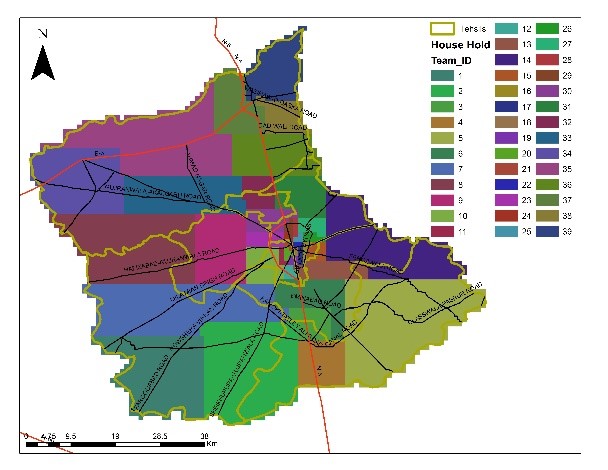 • Figure 5: location of teams and Roads
 • Figure 4: Teams with no. of Houses
 • Figure 5: location of teams and Roads